4 Altcoins Reach New ATH – The Week’s Biggest Winners

Bitcoin Magazine will analyze the seven altcoins that have risen the most in the past seven days to see if their momentum can continue.

These top bullish altcoins are:

  1. Loopring (LRC): 175.25%
  2. Kadena (KDA): 117.15%
  3. Cartesian (CTSI): 50.05%
  4. Helium (HNT): 48.27%
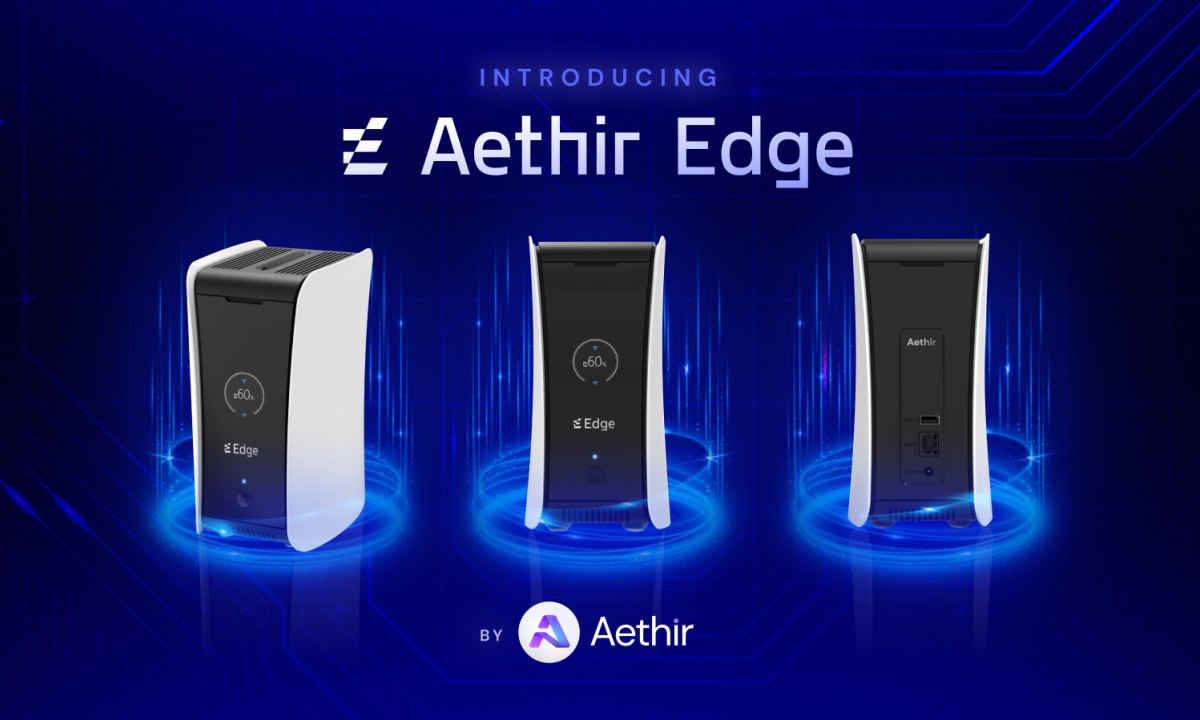
  5. Edge (XVG): 37.57%
  6. Mina (MINA): 32.64%
  7. Litecoin (LTC): 29.18%

LRC

LRC has grown rapidly since November 4th. It grew 263% in just six days. This resulted in a new all-time high of $ 3.85 on November 10th.

When measuring the previous decline, it hit a high near the external fib retracement level of 4.618. This level often acts as the top in parabolic upward movements.

In addition, the token has created a long wick on top (red icon) for three consecutive days. This is viewed as a bearish sign as there is strong selling pressure at higher levels.

So the LRC has most likely reached a local peak.

If so, the next supports are at $ 2.79 and $ 2.46.

7-altcoin-tang

LRC / USDT daily chart | Source: TradingView

KDA

KDA has grown rapidly since September 29th. It is up 1,952% in 43 days. This resulted in a new all-time high of $ 28.30 on November 10th.

Similar to LRC, two long wicks (red symbol) were created above, which is a sign of sales pressure and has been falling since then.

If the KDA continues to decline, the next supports will be at $ 18.02 and $ 14.83, respectively.

7-altcoin-tang

Daily KDA / USDT chart | Source: TradingView

CTSI

CTSI has risen since September 22nd. That rally resulted in a breakout above the USD 0.96 area on November 10th. The next day, CTSI hit a high of $ 1.73. The token has yet to hit a new all-time high and is just below its target of $ 0.02.

CTSI has since fallen. If this continues, the USD 0.96 zone is expected to act as support.

7-altcoin-tang

CTSI / USDT daily chart | Source: TradingView

HNT

HNT has risen since it erupted via an ascending parallel channel (green icon) on November 3rd. The spike culminated in a new all-time high of $ 59.27 on Nov. 7, however the token made a long top wick on the same day and has moved lower since then.

In addition, it hit a lower high on November 11th before continuing its downward movement. This is a bearish sign and could result in a slight correction or consolidation.

The next areas of support are at $ 37.5 and $ 32.5.

7-altcoin-tang

HNT / USDT daily chart | Source: TradingView

XVG

XVG has been on the rise since September 28th. It hit a high of $ 0.037 on Nov. 12, but was negated by a horizontal resistance area that has existed since May. This is the third time the token has erupted. red symbols).

With areas of resistance weakening with every touch, the token is likely to explode soon.

If XVG does manage to break out there will be no more horizontal resistance until it hits a high of $ 0.07.

7-altcoin-tang

Daily XVG / USDT Chart | Source: TradingView

MINA

On November 12th, MINA hit a new all-time high of USD 6.68. However, on the same day it made a long top wick and fell. This move created two tops that are viewed as a bearish reversal pattern.

Additionally, the token fell below the resistance area of ​​$ 6.15. As long as the price does not move above it, the trend cannot be considered bullish.

If it manages to break it, the next resistance will be at $ 8.17. This is the external fib retracement resistance of 1.61 when measuring the previous drop.

1636778978 814 4 Altcoins Reach New ATH The Weeks Biggest Winners

Daily MINA / USDT chart | Source: TradingView

LTC

LTC has risen rapidly since November 7th. The next day, it broke the $ 230 resistance area and hit a new high of $ 295.7 on November 10th.

The high was created directly at the retracement resistance of 0.618 Fib. If the LTC can break out, it could soar quickly due to the lack of overhead resistance.

Conversely, the $ 230 zone is expected to act as support if a short-term decline occurs.

1636778979 702 4 Altcoins Reach New ATH The Weeks Biggest Winners

LTC / USDT daily chart | Source: TradingView

You can see the coin prices here.

Join Bitcoin Magazine Telegram to keep track of news and comment on this article: https://t.me/coincunews

Disclaimer: This article is for informational purposes only, not investment advice. Investors should research carefully before making a decision. We are not responsible for your investment decisions.

SN_Nour

According to Beincrypto

Follow the Youtube Channel | Subscribe to telegram channel | Follow the Facebook page

Visited 53 times, 1 visit(s) today

Leave a Reply